Project Management is truly something many people are opinionated about. As software development evolved over time we saw new paradigms and philosophies towards projects, we can see this by the adoption of Agile and as great as it is - you can’t build a house as a series of Kanban boards and Sprints, but you can build software with a Gantt chart.
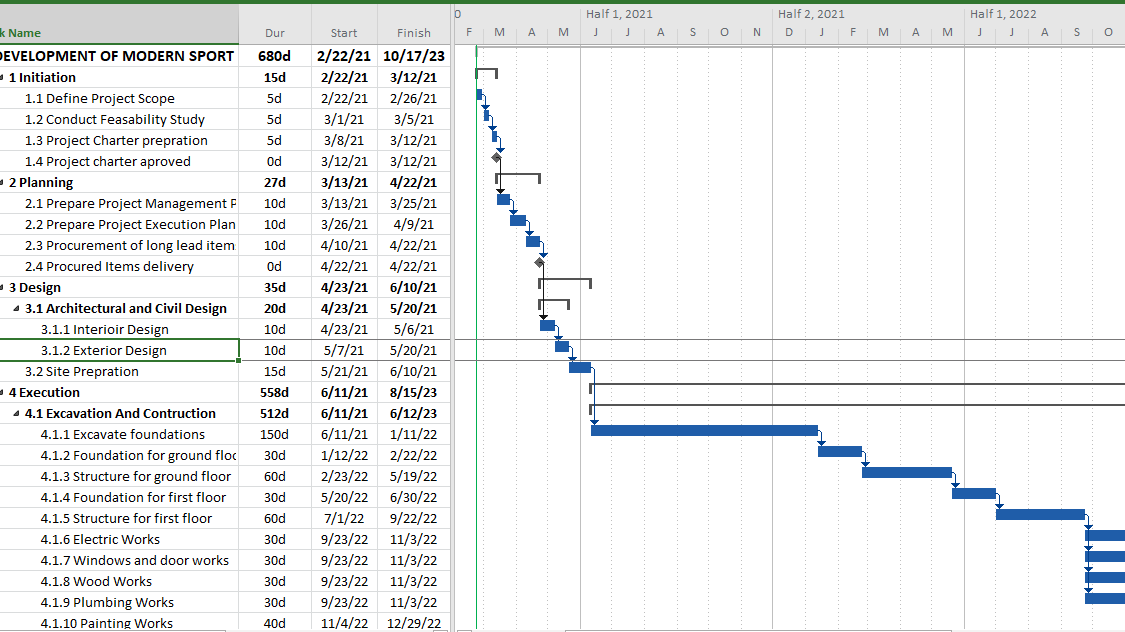
For the uninitiated, a Gantt Chart is a horizontal bar graph with Tasks on the Y-axis and Time on the X-axis. The length of the bar denote the length of time estimated to complete that task, and are connected together with an arrow as either a predecessor or successor. Diamond shaped markers are Milestones, the are a fixed date and only serves as a successor to it’s tasks and predecessor to the deadline. Finally, tasks can grouped together in phases and all elements can be allocated to a team member.
Several software packages have some form of Gantt chart, or timeline view, and is used as way to digest a project in it’s entirety. But with Kanban boards and Dynamic Lists with custom fields, why would you go with the Gantt?
Here are a few reasons:
People
Tasks all have something in common, people need to complete them. Gantt Charts enable the Project Manager to add people and communicate the responsibility of delivering on time both internally and externally.
Timings
When projects get complicated they get unwieldy. Gantt Charts are a clear concise way to show all tasks, milestones and deadlines and communicate the duration and expected delivery.
Interconnection
Every task in a project in a task has at least one connection as a dependency to a milestone, and those milestones to the deadline. Gantt charts serve as a very good visual aid to how a mass of tasks and people connect together to deliver a project, and where attention has to be focused.
Simultaneous work
With multiple tasks it would be inefficient to do one after the other, that would be very silly. Therefore being able to see exactly where you can run parts of your project concurrently and in parallel will give you and your team maximum productivity.
Critical Path
When you make all of the necessary connections between tasks, milestones, and the deadline, whilst also adding the time required to complete, the longest chain leading to the end of the project will be the critical path. Any delay here will delay the whole project so requires the most amount of attention to deliver.
Blockers
All tasks have a potential to be blocked, it may look like an external stakeholder not providing vital data. Internally you might not have the team to deliver, or even the technology available. This can cause major issues for your deadline, but a Gantt chart can spot these before they occur and therefore the right action can be taken.
Capacity
We all only have so many hours in the day, and therefore only so much that we can do. Poorly run projects have the same hallmark, too much to do, to few people to do it. A Gantt chart that is complete can essentially be organised per team member to show if every team has the capacity to get the work done and reach milestones, if the answer is no it is job of the Project Manager to rethink and redefine the project.
Change management
Stuff + Time = Change. It’s the one inevitability that applies to everything. So in the lifecycle of your project change will come along, and challenge your goals. A good Gantt chart can see where the buffers and bottlenecks are, so as things alter then it can be compensated for to stay on target for the deadline. Also, having goal focused tasks that have a purpose will help pivot in the event that something becomes impractical and non-feasible.
Gantt charts are a great tool for planning, scheduling and delivering projects. Even with small projects on the books, to ability to find bottlenecks and delegate will mean that success in reaching goals is always focused. Tools you can use to create a Gantt charts are:
Spreadsheets - Excel or GSheets
Microsoft Project
ClickUp
Asana (timeline view)
Notion.so (timeline view)
It may take a few attempts to become a Gantt master, but when you do it’s a fantastic tool forever!
If you need help to build a Gantt chart for your project, or any other Project Management needs, Chuffed Solutions is here to help, book a slot to say hello and talk about how we can manage your project to success.